
Motivation
These posts will when completed will be a document which will investigate use of electricity. Focusing on information technology (IT) electricity usage within organisations. This study will discuss existing electricity energy consumption, potential future energy demands and associated costs. This will use existing literature on energy consumption, primary research conducted for this project and review current energy monitoring tools. This information will be analysed and used to design an energy monitoring tool for organisations. The product will monitor electricity usage of Internet Protocal (IP) connected devices, and collate usage information into groups. The product will operate as a self contained (Black Box) unit running on a single virtual machine (VM). To prove the concept, the solution will be initially installed in a Virtual Environment. The virtual environment will allow for basic testing. The Black Box will then be migrated onto a VM within a physical laboratory environment. This physical environment will allow to a comparison of measured energy usage against real utilisation.
Rise and rise of Information Technology
The Internet and electronic communications may well be the largest single industry the world builds and develops this century. It could be argued that the Internet is now the central nervous system in an increasingly “switched on” world. Computer processing and technological innovation has created an industry which appears to generate demand and then feed a world with a seemingly insatiable appetite for messages, photos and video streaming. IT has changed the speed and scale of established industries from financial, to transportation to retail. IT has altered the way we work, rest and play. Email and teleconference have largely replaced postal letters and travel to meetings. TV, Social Media and Websites are used, slowly replacing printed newspapers. Online ‘gaming’ and communication over social media platforms rather is now more popular that visiting a pub and ‘chat’
Growth of networks
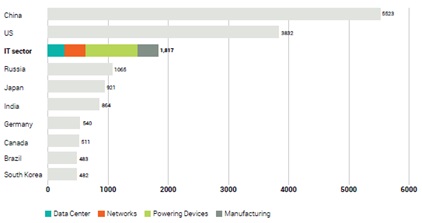
The importance and growth of IT services within organisations has been well catalogued and documented. A Cisco report in 2017 summarised IT growth by measuring and forecasting global Internet protocol (IP) traffic and the number of IP devices. The report states “Global IP traffic will increase nearly threefold over the next 5 years, and will have increased 127-fold from 2005 to 2021“. The report goes on to say that “The number of devices connected to IP networks will be three times as high as the global population in 2021”. The UN predict there will be 7.5 billion people in 2021. So, there will be circa 22 billion connected IP devices in the world in 2021. This increase in IP devices has resulted in organisations building ever more complex enterprise networks to support their businesses. These large business critical computer estates have increased energy costs for companies. These costs have resulted in real impacts on company profitability, and an increase in the generation of greenhouse gases. The IT sector now consumes more energy than most countries in the world
Power Terminology
When referring to power or energy, this report is specifically referring to watts and watt-hour (Wh) respectively. Electric current is the ow of electric charge measured in Amps. Amps are the amount of electric charge transferred by a circuit per second. Power is the rate at which the system performs the work, while energy is the total amount of work performed over a period of time.
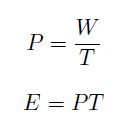
Where P is power, T is time, W is total work performed during that period of time and E is energy.
Energy Production
The IT sector’s increased energy demands have resulted in the industry being a larger contributing factor in global energy related CO2 emissions. Total global emissions have grown from 14 gigatonnes (Gt) of CO2 emissions in 1970 to 30Gt in 2010. Emissions are due to grow to 35.7 Gt in 20401.
Global energy demand will still be mostly met by fossil-fuels (i.e. coal, oil and gas). In 2000, fossil-fuels produced 80% of global energy. Through international, regional and national policies, the world looks to reduce reliance on fossil-fuels by 5% by 20401.
The World Energy Outlook (WEO) revise their 2040 projected figures on an annual basis. In 2016 their report forecasted 36.3 Gt of emissions in 2040. The following year this was revised down to 35.7 (600 million tonnes). This revision was due to India and China policies around renewable and electric vehicles. Some large IT companies have responded to this increased demand for energy by quantifying their energy usage. These companies now report on their energy usage and identify their energy sources (renewable or fossil). This information is used to reduce their energy consumption and adopt renewable energy sources. Through the use of
qualitative measurements, organisations can measure their progress. 2
Energy Costs
Industrial energy costs within the UK have increased from 3.53 pence per kWH (kilowatt Hour) in 2001 to 9.28 pence per kWH in 20163. Energy prices in the UK are 27% higher than the medium of other countries in the International Energy Agency (IEA) group of countries. In 2016, average UK industrial electricity prices including taxes were one of the highest in the IEA. UK electricity prices were fourth highest in the G7. Global energy demand and prices continue to rise.
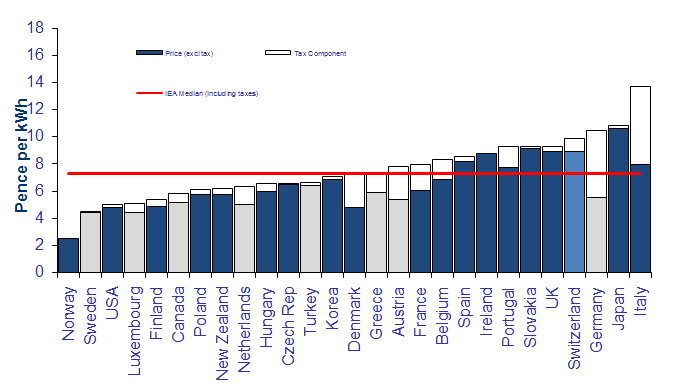
((BEIS, 2017. Department for Business, Energy and Industrial Strategy. [Online] [Accessed 20 April 2018]))
United States Energy Information Administration (EIA) expects energy prices to rise by between 50% and 120% from their 2016 pence per kWH by 2050.4 The EIA illustrate three possible paths for U.S energy growth.
1. High Economic Growth case assumes high growth (2.6%) and low inflation (1.9%)
2. Medium case assumes growth of 2.2% and inflation of 2.1%
3. Low Economic Growth case assumes lower growth and higher inflation rates (1.6% and 3.2%, respectively)
In general, higher economic growth (as measured by gross domestic product) leads to greater investment, increased consumption of goods and services, more trade, and greater energy consumption.
Climate Change
The Intergovernmental Panel on Climate Change (IPCC) has reported that:- \human influence on the climate system is clear, and recent anthropogenic emissions of greenhouse gases are the highest in history. Recent climate changes have had widespread impacts on human and natural systems. The atmosphere and ocean have warmed, the amounts of snow and ice have diminished, and sea level has risen” [32].
Politicians around the world agreed to hold the increase in global average temperatures to below 2 degrees Celsius of pre-industrial levels. The 2016 Paris Agreement decided to move the world towards low greenhouse gas emissions and support climate-resilient development.
Summary
A consensus view has emerged over the last few years about the impact of humans on the climate system5 . Energy costs have increased and continue to increase6 . Energy consumption within the IT sector is now greater than all but 2 countries. Companies are aware of the challenges of increased demand for IT services (both environmental and fiscal costs). This project will develop a tool which can provide meaningful, accurate energy usage data. This is essential to justify investment in energy efficiency and measure the outcomes7. This project is motivated by:
- Increased Demand. The IT sector is growing fast; this growth is increasing energy usage and energy costs.
- Supply side pressures. Global energy production costs are predicted to increase which will have a negative impact on IT profitability.
- Environmental Cost. The IPCC has reported on adverse impacts of increasing greenhouse gases on human and natural systems. The 2016 Paris Agreement bound most countries in the world to halt or reduce greenhouse gases.
This project sees an opportunity to support the IT industry to reduce their energy usage. Through advanced load identification and management technologies, electric energy consumption and carbon emissions in buildings can be reduced. By providing a cost effective system for monitoring of energy usage in an efficient way.8
- WEO, 2017. World Energy Outlook 2017, Paris: OECD Publishing [↩] [↩]
- Greenpeace, 2017. Clicking Green : Who is winning the
race to build a green internet?. [Online] [↩] - BEIS, 2017. Department for Business, Energy and Industrial Strategy. [Online] [Accessed 20 April 2018] [↩]
- Trends in Electricity Consumption for Consumer ICT, Peter Corcoran and Andres Andrae (2013) and CIA World Factbook. China/Russia/Canada gures are from 2014 [↩]
- IPCC, 2014. Climate Change 2014 Synthesis Report Summary for Policymakers. [Online] [Accessed 20 April 2018]. [↩]
- BEIS, 2017. Department for Business, Energy and Industrial Strategy. [Online] [Accessed 20 April 2018] [↩]
- Theema, 2018. EMA MAG MAY 2018 [Online] [Accessed 30 May 2018]. [↩]
- Du, Y. et al., 2010. A review of identification and monitoring methods for electric loads in commercial and residential buildings. Atlanta, GA, USA, IEEE. [↩]
Hey Sanjeev – definitely have some feedback on your recent blogs you may or may not be interested in. Reducing energy costs and identifying technical issues in both residential and commercial buildings is something I have also been researching the past few months which may offer some ‘synergy’ between us. Worth a chat? 🙂
Cheers
Colin