
Introduction
This chapter will seek to build a virtual test environment to prove that a polling agent is able to poll devices and display basic statistics on a website. Once the baseline PoC environment is functioning, the system will focus on energy reporting. This will prove that a polling agent is able to display energy usage in a graphical form. The PoC will test energy usage reports can collate information based on site or subnet (i.e. all devices on a subnet report as a single energy footprint) and they can be “drilled down into” and report on individual components. Success criteria is a virtual monitoring server can poll and report on virtual power usage from three device types:
- A device with a SNMP MIB providing power usage
- A device with SNMP but not a power utilisation MIB
- A device not supporting power utilisation
The PoC environment will reside within a virtual environment and so will not consider scalability or resilience.
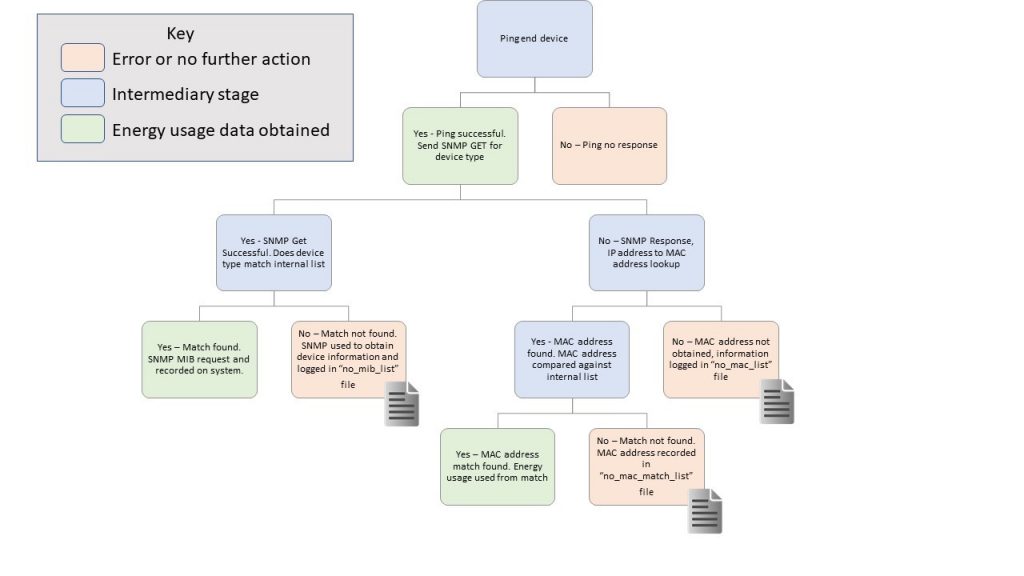
Figure above illustrates the logic that the polling agent will use to obtain information from devices to report energy use.

Figure above illustrates web page types which will be generated by the system. The system will generate individual webpages for all devices successfully monitored. In addition, information will be grouped by device type and by location.
PoC Testing Environment
A proof of concept environment (PoC) is built to test the principles behind the solution and is installed on a Dell Laptop running Windows 10 with 250 GB of hard disk and 16GB of RAM.
The laptop runs VMware Workstation 12 Pro to launch two virtual machine instances. Conceptually, one VM environment will act as a customer site and the other will act as the energy management solution being developed.
\subs
Cisco’s Virtual Internet Routing Lab
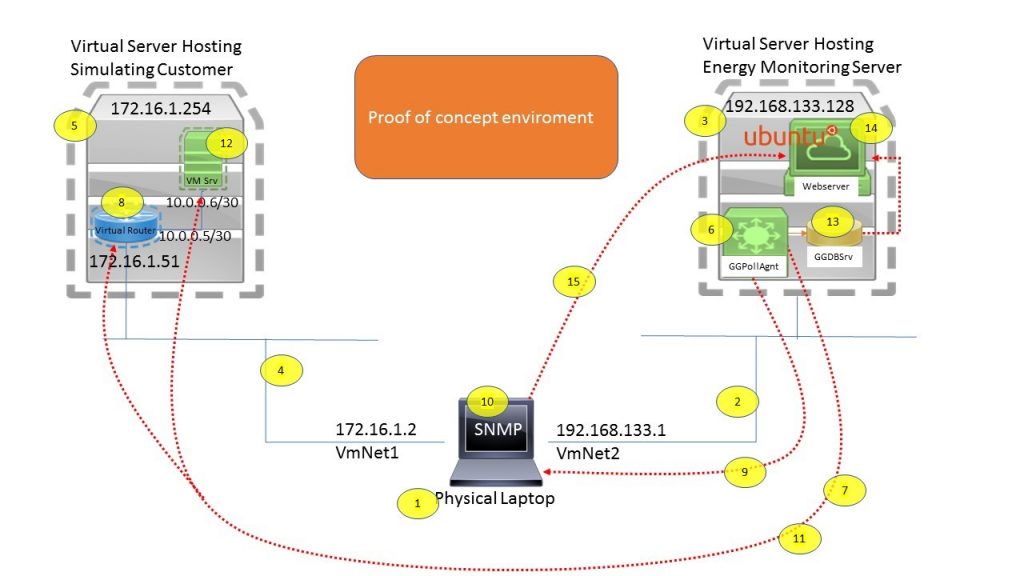
The VM acting as the customer will run Cisco’s Virtual Internet Routing Lab (Virl). VIRL is a Cisco licenced product, which comes in the form of a VM image. It is a Cisco provided prebuilt VM environment, used to test Cisco switches and routers within a virtual environment((Cisco, (2018). Virtual Internet Routing Lab. [online] Available at: \href{http://virl.cisco.com/}{http://virl.cisco.com/} [Accessed 25 April 2018])). When installed in a VM Client (e.g. VMWare Workstation) a customised Linux operating system is loaded. Within this virtual Linux server Cisco have provided a VIRL tool. The VIRL tool/application allows for further virtual devices to be created. For the purposes of this PoC, virtual devices being created are intended to simulate the customer site being polled. This VIRL environment simulates a customer switch, two IP networks and linux server. The switch is able to respond to SNMP MIB requests, and the linux server is only able to respond to IP PING requests. The VIRL environment has 12GB of RAM, 80GB of hard disk space allocated to host a virtual lab. Refer to Figure below, number 3 in yellow illustrates the VIRL VM environment residing on the Dell Laptop.
Energy Management VM
GGAppSrv is the VM built to host the solution being developed. The VM uses Ubuntu Version 17.10.1 as its operating system. This version is selected as it is the latest stable release((Ubuntu, 2018. Ubuntu Release. [Online] Available at: \href{https://wiki.ubuntu.com/Releases}{https://wiki.ubuntu.com/Releases} [Accessed 15 April 2018])). The VM is resourced with 10GB of hard disk and 1GB of RAM. Due to physical limitations on the host Dell laptop, resource allocation is less than Ubunto’s recommended allocation1. Via Ubunto’s LVM (logical volume manager) the VM is named GGAppSrv, the hard disk is not encrypted. As this is a PoC environment firewall services are disabled. Baseline freeware / shareware software is installed on the GGAppSrv server to support the solution
| Software | Description |
|---|---|
| Apache | HTTP and HTTPs webserver service |
| MySQL | Database management tool |
| PHP | Web development scripting language |
| Tomcat Java | Java Servlet Container |
| openssh-server | remote console connectivity |
| Python v3 | provide the scripting language to produce config files of devices to poll |
| netaddr2 | to for layer 3 and layer 2 addressing manipulation |
| multiping3 | to support IP pings and retries |
| pysnmp | to support scriptable SNMP MIB polling. |
| libpango1.0-dev | library for layout and rendering of text, |
| libxml2-dev | support customised markup language |
| libgd-dev | graphics library |
| libpng-dev | produce .png graphics |
| zlib1g-dev | deflate compression method |
| mrtg-2.17 | monitors SNMP and produces graphs |
The “Proof Of Concept Environment” Figure above illustrates the baseline PoC environment, the numbers in yellow are further referenced in Table below, which provides narrative for the diagram. As the environment is entirely virtual, the PoC setup will not be able to report on real power utilisation.
| Ref | Description |
|---|---|
| 1 | The physical computer this PoC, is running from. All other devices and networks within the diagram are virtual. |
| 2 | Virtual network from the physical laptop to a virtual server running Ubuntu operating system. |
| 3 | Virtual server running Ubuntu operating system used to host all energy monitoring components i.e. polling agent, data storage and web server. |
| 4 | Virtual network from the physical laptop to a virtual server running network emulation services. |
| 5 | Virtual server running virtual emulation services. |
| 6 | Polling agent running on the virtual server. |
| 7 | SNMP GET commands sent regularly to the emulated Cisco Router (number 8). |
| 8 | The emulated Cisco Router with SNMP read only community string configured. This device responds to SNMP requests with the standard interface utilisation information. |
| 9 | SNMP GET commands sent regularly to the physical computer. |
| 10 | The computer running Microsoft Windows 10 and has SNMP read only community string configured. |
| 11 | Regular PINGs sent to device to record keepalive. |
| 12 | Non SNMP enabled server. |
A number of scripts and settings files have been created to deliver the functionality illustrated in diagram Proof of Concept Diagram. These scripts run to produce a series of config files which can then be run to poll end devices and obtain power statistics.
Scripting
This section lists out the scripts produced to poll and report on power utilisation. The PoC is intended to prove that a system can regularly collect information from three types of IP devices and present information in a graphical form. To this end, a settings file and 3 python scripts are produced.
- main.py – the script which is called to initiate polling a subnet or series of subnets.
- settings.ini – basic polling settings e.g. SNMP MIB to poll.
- search_by_snmp.py – This script is used for devices responding to SNMP polling. The script compares the response against an internal file (SNMPtoDevice). If the device is listed within SNMPtoDevice then the script produces a config file which can be used to poll energy stats from the device. If the SNMP device is not within the SNMPtoDevice file, the the device is logged within an error log file (NotInMibList). This log file can then later be viewed and the SNMPtoDevice updated accordingly.
- search_by_mac.py – This script is used for devices responding to PINGS but not to SNMP polls. The script compares the IP address against an internal list which has IP addresses and MAC addresses (IPtoMAC). If there is a match between the IP address and MAC address, then the IP address is compared against an internal list called MACtoDevice. If a match is found, a CFG file is written with energy usage information obtained from MACtoDevice. The device is then periodically PINGed, if the device stops responding to PINGs the cfg file is deleted.
- NoMacList – If there is not a match between the IP address and MAC address (i.e. IPtoMAC) a log entry is added to NoMacList.
- NoMacMatchList – If there isn’t a match between the MAC address and the MACtoDevice file, a log entry is added to NoMacMatchList. The NoMacMatchList can be used to identify devices which are able to be polled but are not added to power usage stats.
Reporting
The platform is designed to collect power usage from SNMP MIB enabled devices and to use implied measurements for devices which respond to pings but do not provide direct MIB power utilisation measurements. Python scripts follow the process illustrated in Figure “Flowchart illustrating PoC polling logic”, to produce configuration (cfg) files. These cfg files are used by the system to poll individual devices and record power utilisation.
Reporting Graphical Visualisation
This section looks at presenting that information to users in a readable way. The “A Task Taxonomy for Network Evolution Analysis” study4 suggests formal classification of task features and entities. The report classifies contributions as:
- Graphical x-axis – entities i.e. either nodes/links, groups, or networks
- Graphical y-axis – temporal features i.e. either individual events, shape of change and rate of change
- Graphical z-axis – properties i.e. either structural or domain properties
This paper is collecting node power utilisation information (i.e. Graphical x-axis) and over a period of time (i.e. Graphical y-axis). No structural or domain information is being collated. 7 possible visual representations of data were identified5. Table below takes a standard sample set of power utilisation information and presents the information in various ways.
| Title | Description | Image |
|---|---|---|
| Line Graph | Simplest way to represent time series data. This type of graph provides a quick sense of how something changes over time. | 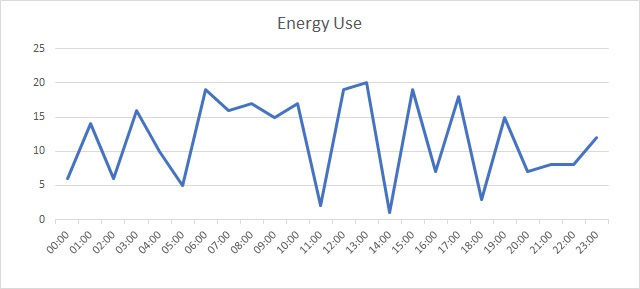 |
| Stacked Area Chart | Line type graph able to stack multiple variables on top of each other. Stacked area charts show how both a cumulative total and individual components of that total changed over time. | 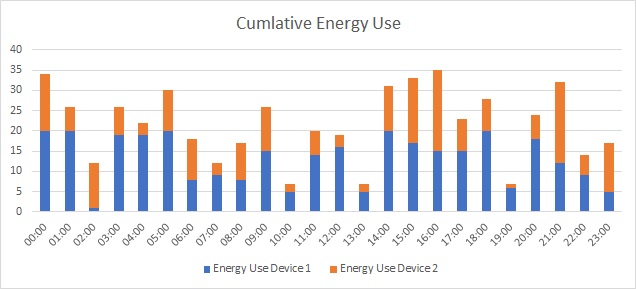 |
| Bar Charts | Bar charts represent data as horizontal or vertical bars. The length of each bar is proportional to the value of the variable at that point in time. | 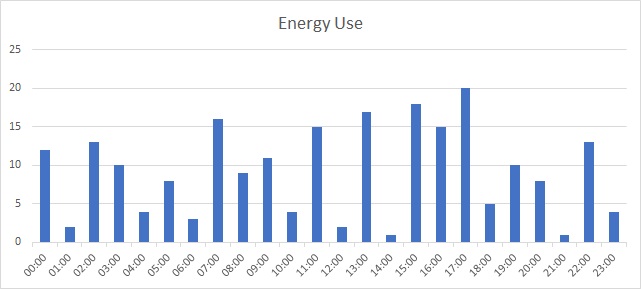 |
| Gantt Chart | A Gantt chart is a horizontal bar chart showing work completed in a certain period of time with respect to the time allocated for that particular task. |  |
| Stream Graph | A stream graph is essentially a stacked area graph but displaced around a central horizontal axis. | 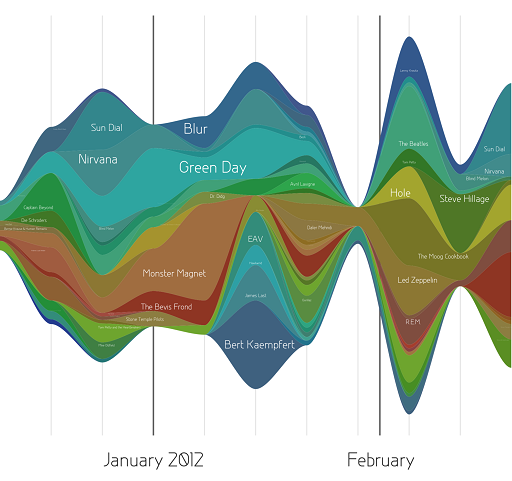 |
| Heat Map | Geospatial visualisations often use heat maps since they quickly help identify hot spots or regions of high concentrations of a given variable. | 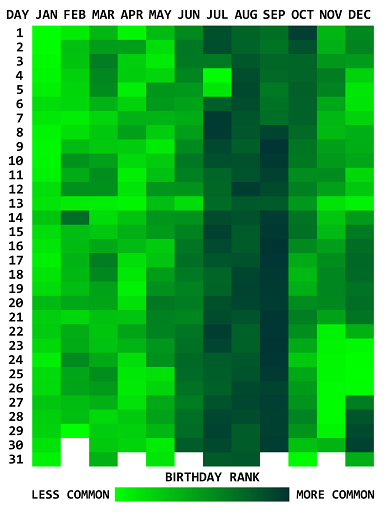 |
| Polar Area Diagram | Illustrating cyclical time series data can be i.e. a season in a year, time of the day. | 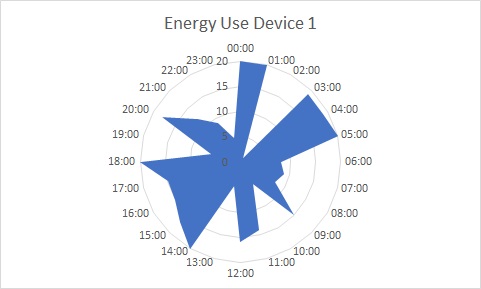 |
After conducting a interview with Mr Phelps it was agreed that a simple line graph would best represent power utilisation over time. The line graph below illustrates the agreed power visualisation format
Grouping of Data
The platform will create configuration (cfg) files for all monitored devices. The name of the cfg file will be dependent on whether the monitored device is SNMP MIB enabled or non-SNMP MIB enabled. These cfg files will be used to generate poll end devices and create individual device statistics. All cfg files created will produce reports for energy use over the last 24 hours (5 minute average), weekly (30 minute average), monthly (2 hour average) and yearly (1 day average). The number of individual devices being monitored could be very large, so to simplify reports cfg files will also be grouped together. After conducting a survey, it was concluded that the following reporting groupings would be developed and information would be displayed using line graphs viewable via a website.
- GROUP 1 – All Devices This file will calculate the total energy used for all devices monitored accross all sites. A single file, listing all CFG file names created (alldevices.cfg) The file to list all config file names on a single line separated by additions
- GROUP 2 – By Subnet Create groups based on the IP Subnets being polled. Devices being monitored will be grouped by the IP subnet they are in. The IP Address within the cfg file name to be grouped by the 3rd octet.
- GROUP 3 – By Building This adds together total power consumption of IP subnets (i.e. GROUP 2 cfg files) based on the buildings they are associated to. The “BuildingGroup” setttings file associated IP Subnets to buildings. A script sums together GROUP2 cfg files together based on matches in the list. e.g. the “BuildingGroup” may have an entry that says Building1, 10.1.1.x, 10.1.200.x, 10.200.0.x. The script then creates a cfg file which references all10.1.1.x.cfg, all10.1.200.x.cfg, all10.200.0.x.cfg
- GROUP 4 – By Device Type This compares the cfg files created and groups them based on device type. For CFG files with the format $<$IPaddress$>$$<$SystemName$>$$<$DeviceType$>$.cfg, use the $<$devicetype$>$ reference to group all devices with the same DeviceType. Group name to be obtained from DeviceGroupByType. For CFG files with the format $<$IPaddress$>$$<$MAC address$>$.cfg. The $<$MAC Address$>$ to be compared against the DeviceGroup file and group devices based on wildcard MAC addresses e.g. if the file is called 10.1.1.1. 94DE80429B6C.cfg and another file is called 10.100.10.1.94DE80411111.cfg and the entry in the DeviceType has 94DE804XXXXXX create a cfg file listing out both 94DE80429B6C.cfg and 94DE80411111.cfg
- GROUP 5 – By Group Within this grouping, device types (i.e. GROUP 4) are grouped together and single cumulative power consumption figures are produced. This selects cfg files which match entries in the device group settings file. This grouping allows for several device types to be grouped together. e.g. there could be two group 4 device types “Desktops” and “Laptops”.
- GROUP 6 – Group By Mac Groups devices by MAC address wildcard. e.g. a file is called 10.1.1.1.94DE80429B6C.ini and another file is called 10.100.10.1.94DE80411111.ini and the entry in the DeviceType has 94DE804XXXXXX, sum the MAC address wildcard, This process uses exiting power measurements for individual items and aggregates that data to provide additional reporting.
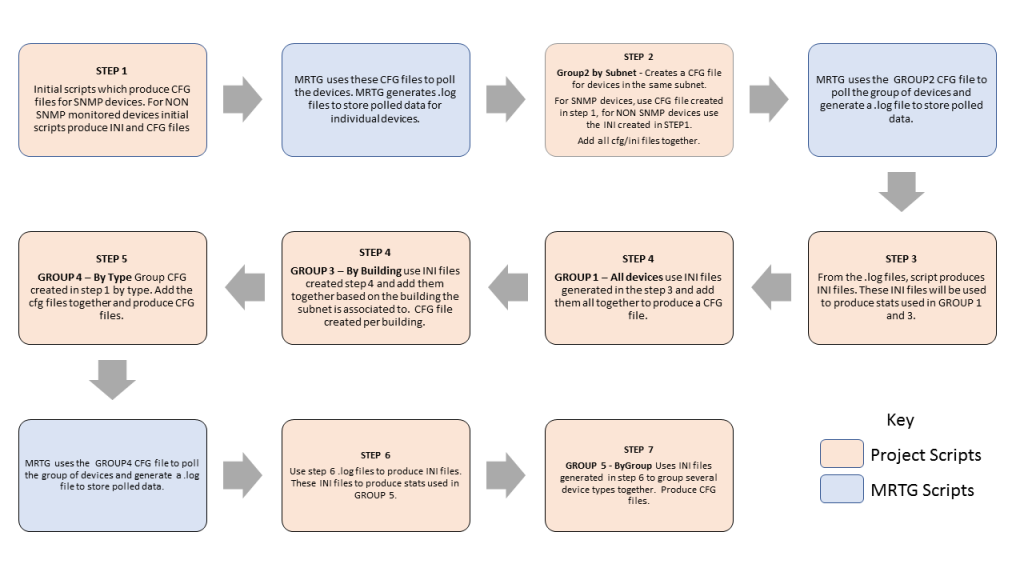
Figure above illustrates how groups detailed above will be created, as further narrative,
- Step 1, all IP devices will be polled and the scripts (Scripts will be shared in a seperate post) will produce individual CFG files. MRTG will use these CFG files to poll devices and collect individual device energy consumption information.
- Step 2, Group 2 cfg files are created by the system, using the CFG files created in Step 1.
- Step 3, from the log files created by MRTG, the scripts will create INI files, these ini files will be used to produce Group 1 and 3 stats.
- Step 4, use the INI files created in step 3 and create a single CFG file to produce Group 1 cfg file.
- Step 5, use the INI files created in step 3 and create CFG files based on the Building IP Address range to produce Group 3 cfg files.
- Step 6, use CFG files created in Step1 and collate them together based on device type to produce Group 4 cfg files.
- Step 7, use step 6 MRTG created log files to produce INI files for Group 5.
- Step 8, use the INI files created in step 7 to produce CFG files
Test Results
As part of the Agile development approach a number of tests were run against the initial PoC environment. Initially testing failed and development work iterated the product to pass the test. All tests are run against the initial PoC lab.
Test 1 – Successful SNMP devices
Test the scenario where a network has two devices and the main python script is run manually. Both polled devices are SNMP enabled and have SNMP MIBs which could be polled. One of the devices is defined in the system and the other not. This will prove that networks can be polled, one CFG file created for the device which is defined and one error is logged in the log file.
main.py script manually
sudo python3 main.py 192.168.0.0/16 10.0.0.0/24
Expected results is one cfg files created and one row logged in “NotInMibList”. This test identified a system limitation, the platform is unable to poll more that than 65535 host. Going forward networks with a subnet mask of 255.255.128.0 or longer are supported e.g.
sudo python3 main.py 192.168.0.0/17 192.168.128.0/17 10.0.0.0/24
Test 2 – SNMP 2 smaller subnet
Test the scenario where a network has two devices and the main python script is run manually. Both polled devices are SNMP enabled and have SNMP MIBs which could be polled. One of the devices is defined in the system and the other not. This will prove that networks can be polled, one CFG file created for the device which is defined and one error is logged in the log file.
Expected results, one cfg files created and one row logged in “NotInMibList”. This test identified two issues,
- the platform is case sensitive when naming files.
- the script to produce \enquote{alldevices.cfg} file did not produce an ini file.
Both issues were resolved and tests subsequently passed.
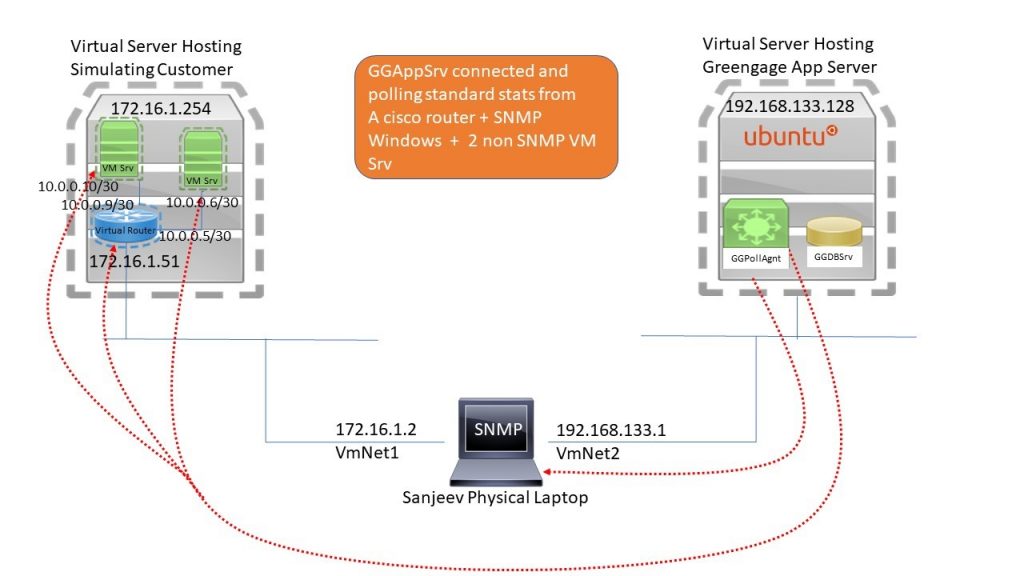
Test 3 – Functioning Known Good State
Test scenario where the platform can poll four devices as illustrated above. This will prove that the system can create CFG files and MRTG is able to use these poll and collate power statistics for four different devices types.
- SNMP router – in site1, type router, energy use 2
- SNMP laptop – in site1, type server, mac address match, energy use 4
- Non SNMP server – in site2, type server, mac address match, energy use 3
- more Non SNMP device – in site2, type server, no mac address match, energy use 300
Expected results – a cfg file created for each of the devices being polled. These cfg files to be run by MRTG6 and poll energy usage. These individual cfg files would be collated into a overall “Building” cfg file and would sum all energy used by the devices and display them in one graphical display. Issues were experienced with incorrect MRTG file formatting, cfg files created had various typos. This was resolved by referencing to the MRTG website6 for the correct file format. The second issue identified was a “Building” cfg file was not created. This was a result of issue one. Once the basic device polling worked, typo corrections were made within the “Building” file and results displayed.
Test 4 – Files produced and validated
Test scenario that the CFG files produced in Test 3 produce correct energy usage data and that the information stored is retrievable from the correct locations.
Expected results – Dependent on the type of device, different configuration and data repository files are required.
- SNMP Devices with a MIB to directly measure power consumption
- A .cfg file which lists out the SNMP MIB required
- .log files containing polled data
- .html file which provides a webpage for statistics obtained
- .png files containing graphical representation of the polled data
- SNMP
- .ini file which contains the device name and power utilisation
- .cfg file which lists references to ini file to obtain power statistics
- .log files containing polled data
- .html file which provides a webpage for statistics obtained
- 4 .png files containing graphical representation of the polled data
- None SNMP Devices to measure power consumption
- .ini file which contains the device type and power utilisation
- .cfg file which lists references to ini file to obtain power statistics
- .log files containing polled data
- .html file which provides a webpage for statistics obtained
- .png files containing graphical representation of the polled data
The solution has been developed to logs all files into a single folder. This results in a single folder with multiple files, some providing webpages (HTML and PNG) some providing log files and others configuration and settings files. As the number of devices monitor grows, this folder would become large.
So this was resolved by amending scripts so that files are stored in different directories. All cfg and ini files be located in a new subfolder called cfg “/home/ggadminuser/snmp/cfg”. All remaining files located in “/var/www/html”
Summary
Using the PoC environment was successful. Testing evidenced that scripts could be written which would PING subnets and identify devices which respond and produce graphical representation or statistics obtained. Testing proved that statistics could be obtained from three types of devices
- Devices with SNMP MIBs
- Devices with SNMP but no direct MIB to poll
- Devices which respond to pings but do not support SNMP
Testing evidenced that statistics obtained could be stored and then graphically represented on a website. Through a combination of agile and test driven development, the PoC environment identified issues with initial scripts and limitations within the environment.
The PoC environment identified that the solution is unable to poll more than 65535 hosts. The PoC environment demonstrated that each polled device would create several files, going forward for scalability, file storage locations would need to be considered. Due to the virtual nature of the PoC environment no real power usage information was able to collected.
The proof of concept environment (PoC) successfully met the two of the three main aims, i.e.evidenced that a polling agent can regularly collect information from three types of devices. Tested graphical representation of statistics. The third aim, to test against baseline test scenarios was partially met, however due to PoC Virtual system resource limitations, it was not possible to create more than 4 polled devices. This limitation restricted testing reporting groups.
- Ubuntu Resource Requirements 2018 [Online] Available at: \href{https://help.ubuntu.com/community/Installation/SystemRequirements}{https://help.ubuntu.com/community/Installation/SystemRequirements} Accessed 15 May 2018 [↩]
- A network address manipulation library for Python \href{https://github.com/drkjam/netaddr}{https://github.com/drkjam/netaddr} [Accessed 28 June 2018 [↩]
- Python library to monitor one or many IP addresses via ICMP echo (ping) requests \href{https://github.com/romana/multi-ping}{https://github.com/romana/multi-ping} [Accessed 28 June 2018] [↩]
- Jae-wook Ahn, Plaisant, C. and Shneiderman, B. (2014). A Task Taxonomy for Network Evolution Analysis. IEEE Transactions on Visualization and Computer Graphics, 20(3), pp.365-376. \href{http://doi.org/10.1109/tvcg.2013.238}{http://doi.org/10.1109/tvcg.2013.238} [↩]
- Common data visualizations. [Online] Available at: \href{https://blog.socialcops.com/academy/resources/visualizing-time-series-data/}{https://blog.socialcops.com/academy/resources/visualizing-time-series-data/} [Accessed 19 April 2018] [↩]
- Multi Router Traffic Graphee [Online] Available at: \href{https://oss.oetiker.ch/mrtg/doc/mrtg-reference.en.html}{https://oss.oetiker.ch/mrtg/doc/mrtg-reference.en.html} [Accessed 1 Feb 2018] [↩] [↩]