
Introduction
Encouraging energy conservation will not be easy. By its nature energy is an abstract and invisible force that is conceptualised or commonly defined in a number of different ways, for example as a commodity, as a social necessity, as an ecological resource, or as a strategic material1. The ethereal nature of energy needs to be made “real” through meaningful measurements and reporting. This project intends to provide a method to measure and report on individual IP devices within an enterprise network. Through reporting and visualisation the solution will attempt to make the intangible nature of energy more tangible. The IPCC2 has produced well researched and widely published findings on climate change and the need for energy conservation. This publicity has made discussions about energy less abstract and increased the prominence of energy use.
Energy consumption of residential and commercial buildings has risen steadily in recent years, an increase largely due to their HVAC (heating, ventilation and air-conditioning) systems. 199 TerraWatts per Hour (TWh) was consumed by Great Britain in 1970 against 311 TWh in 20163.
Residential Energy
Significant research and effort has been expended in real time monitoring (RTM) of electricity consumption within the domestic environment4. Studies have indicated that providing end users (in this case domestic energy users) with real time data on their energy usage increases awareness of energy consumption and can reduce energy use in the short term. Power cost monitors, i.e. those monitors which displayed the real time cost of energy use were deemed useful and effective.
The residential energy monitoring market is less mature than the commercial sector. The residential energy market is adopting power meters: of the 28 million households5 in Great Britain, as at 31 December 2017, 8.98 million smart meters are in operation in domestic properties6. The commercial sector has also been implementing energy monitoring, of the 1.83 million premises7 1.01 million smart and advanced meters have been installed in smaller non-domestic sites by both large and small energy suppliers8
The impact of residential real-time energy monitoring (RTM) has been mixed. Studies have indicated that the introduction of RTM results in short term energy consumption dropping by 12\% (short term being 30 days after installation)9. A specific variant of RTM, namely power cost monitors (PCM) which displays the running cost at the current time of use increases user awareness of energy consumption9. Smart home technologies (SMTs) have been shown to enable new domestic energy practices however it has been noted that SMT requires substantial amount of learning within a domestic environment10. The temporary positive impact of RTM in the residential market could be attributed to the Hawthorne Effect11. In this instance the Hawthorne effect is demonstrated by the short term reduction in energy use when an energy monitoring device is first installed and monitored, however after a longer period of time, energy usage returns to previous levels12. Overall energy usage reduction is marginal, between 2 and 3\%13.
Non-residential Energy
A Business, Energy \& Industrial Strategy (BEIS) survey conducted in 2016 reported that non-residential respondents indicated that “89,740 GWh/year (56 per cent of energy was used in premises where respondents indicated that they “actively seek new ways to reduce energy use” (active energy management). 55,090 GWh/year (34 per cent) of energy was used in premises where they “try to reduce energy use where possible, but it’s not a priority” (passive energy management) and the remainder in premises where respondents “have not considered ways to reduce energy use” (no energy management).”14 The report also highlighted the main barriers and facilitators for energy efficiency. The most commonly perceived barriers to energy efficiency were economic ones (low capital availability, investment costs, hidden costs, intervention-related risks, external risks, and interventions not sufficiently profitable). The most commonly cited enablers – respondents said that they believed would help them implement energy efficiency measures on site – were: improved energy management knowledge; increased availability of funding; and, greater buy in from key internal and external stakeholders}((GOV.UK. (2018). Building Energy Efficiency Survey (BEES). [online] Available at https://www.gov.uk/government/publications/building-energy-efficiency-survey-bees [Accessed 20 August 2018])).
Based on the BEIS survey, 56 per cent of energy was used in premises where respondents were actively seeking new ways to reduce energy use through active energy management. Respondents reported that greater energy management knowledge would be a key enabler in reducing energy usage. Extending RTM of power use to enterprise networks (i.e. non-residential sites) would allow facilities managers to monitor energy use based on location and device type. Organisational focus on bottom line bill payment savings and potential payback of less than three years14 could help to reduce the Hawthorne Effect11 experienced in the domestic environment. Examples of commercial organisations who benefited from additional RTM include Superdrug – the UK’s second-largest beauty and health retailer currently operating over 750 stores, including 200 in-store pharmacies.15. and BT – the UK’s largest telecommunications company used RTM to manage and reduce their water and energy usage16. Both companies spent several years working towards energy savings, they both succeeded due to strategic direction and consistent approach.
Existing Energy Monitoring and Management
Whilst Information and Communications technology (ICT) has supported energy management in commercial buildings through developing building management systems e.g. Control and Automation, Smart Metering and Real-time Monitoring17, less effort has been expended in providing more detailed device energy use information. Commercial energy monitoring systems have largely been based on direct power measurements within institutions, buildings or floors18. Energy reporting of individual devices within organisations has required summarisation. The summarisation of reports has typically been done by clustering19. The advantage of clustering and aggregating power consumption is that it is possible to report on a wide array of similar devices and produce an overarching view on energy usage which is easy to interpret. The disadvantage is the loss of direct measurements which means there is a level of uncertainty in the validity of energy statistics being produced. A tool which could monitor all IP devices within a network and then group this individual energy usage based device type or location would be novel within the market.
Phased approach to Reducing Energy
Making meaningful reductions in energy use could be considered a three-phased approach20.
- Phase 1 passively monitor devices in the estate. This phase focuses on providing energy usage information for devices and displaying that information. This information can be achieved in two ways Appliance load monitoring (ALM), through intrusive load monitoring (ILM) and Non-intrusive load monitoring (NILM)((Zoha, A., Gluhak, A., Imran, M. A. & Rajasegarar, S., 2012. Non-Intrusive Load Monitoring Approaches for Disaggregated Energy Sensing: A Survey. Sensors, Issue 12, pp. 38-66. DOI: 10.3390/s121216838)):-
- ILM typically involves adding a physical energy monitoring sensor for each device to be monitored. The ILM then feeds information back to a central reporting platform. ILM systems provide fine grained energy utilisation information, however they require additional extra hardware and incurs installation costs.
- NILM establish the device type from aggregated data acquired from a single point of measurement. For example, a NILM power meter device collecting information about a floor in an office. The power meter could be used to discern when a new device is connected and through “training” match the energy signature to a device type.
- Phase 2\label{Phase2}, extend the use of energy consumption data, including prices and/or projected costs. This encourages users to make cost saving decisions and requires a system to have time of use information or real time pricing information. Using cost to energy use, has been shown to improve consumer understanding of energy consumption and allows end users to “quantify” the impact of switching devices on/off. For phase 2 to be successful and accurate, energy costs would need to be added to systems. In commercial cases, this input may be “real time” as costs vary on time of day.
- Phase 3 \label{Phase3}, actively manage energy use, this would allow users to remotely manage power status of devices (e.g. power off/on). Developers need to be cognisant of the critical nature of IT services, users have come to rely on IT and any reduction in their current “always on” access could be disruptive. Any implementation of phase 3 would need to answer users need for instant, shareable, high quality pervasive access to their services.
Each phase adds complexity and functionality to a power monitoring/management system. Whilst power consumption is not currently built into network management and operating systems, the Green Grid predict that power metrics will be increasingly important21 In 2008, power monitoring was either considered as a ratio of total facility power, or percentage of total facility power. Little regard was given to micro monitoring of edge devices22 such as routers, firewalls which represent the edge of a network.
Edge device power monitoring has been focused on using energy use as a proxy for other network events. Security devices such as firewalls, routers and switches can be monitored for power consumption. Network managers typically use these measurements to report on service issues e.g. power supply failure or as a proxy for identifying security threats e.g. a denial of service (DoS) attack. As an example, a recent study considered measuring and estimating power consumption in Android devices to support energy-based intrusion detection17. Whilst the study considered the different types of energy signatures and attempted to correlate those with security events, the report omitted to discuss the intrinsic importance of energy usage.
Energy monitoring solutions can be classified into:
- Building energy management system. These systems are widely used in commercial buildings to monitor and regulate heating, ventilation and air-conditioning (HVAC) control, often lighting is included within this term23.
- Domestic energy monitors. These are deployed to residential homes which monitor in real time the energy used within the home and display the information often providing real time energy in units and cost.
- Smart meters. These are like domestic energy monitors with the addition that the smart meter sends usage information to the energy provider.
- Intrusive load monitoring (ILM). These are local application monitoring devices (ALM) which provide accurate information on individual components.
- Non-intrusive load monitoring (NILM). These systems take wide measurements and through a process of information signatures, associate additional energy load to device types
This project will focus on developing NILM (point 4 above). The intention is to provide organisations with a non-intrusive way of monitoring energy usage per device. The monitoring tool will then collate and display energy usage into groups.
Existing Solutions
IT companies have tried to develop vendor agnostic energy monitoring systems however, these systems have either been discontinued due to lack of market support, or have ceased development and so, over time, become less relevant. Existing software solutions which measure energy use on enterprise network devices are discussed in the subsections below.
Cisco Energy Manager
Cisco energy manager (CEM)24 is designed to obtain energy usage information for several device types. As different device types have differing native energy reporting capabilities, CEM uses a combination of methods to collate energy usage,
- SNMP. For devices that can support it, CEM uses specific simple network management protocol (SNMP) management information base (MIB) parameters to directly obtain power usage details. For example, most Cisco switches and routers25 with a recent operating system (i.e. above version 11.2) and some Oracle systems26 support SNMP MIB power usage information.
- NO SNMP and NO DOMAIN. CEM allows for custom devices to be added, for example a network connected internet TV which does not support SNMP or domain login could be added manually. An administrator could add the device’s IP address and manually enter their energy usage. The CEM system would then poll the device, if the device responds, power usage would be recorded.
The CEM product has the capacity to report energy for most network devices within a network and is able to manage (i.e. power off/on) devices which support wake on lan27 type service. As of 23rd February 2018, the product is no longer sold and there are no replacement products announced.28. Cisco, the largest network vendor in the world appear to have exited the energy monitoring market.
Night Watchman
Whilst Cisco CEM was able to monitor a wide range of devices types and is able to manage devices, Night Watchman is limited to only monitoring and managing computers i.e. NO SNMP, DOMAIN classified in section \ref{CEM}. The Night Watchman product does not provide energy monitoring services on a wide range of commonly used IP connected devices within an enterprise estate. For example, Night Watchman does not monitor energy usage for routers, switches, wireless access points, IP phones and printers.
Taiga Innovations
As with Night Watchman, Taiga Innovations is limited to only monitoring and managing computers. Their application loads a service on the computer and uses this service to monitor and manage. The application provides the central management platform a consistent view of the node being monitored and is given elevated rights to the PC to manage specific functions e.g. power.
Solarwinds
Solarwinds is primarily used for network monitoring. The software can be used to monitor energy for SNMP enabled devices which have MIBs that report. The platform is not able to report on either devices which have SNMP enabled but which do not have a MIB to report energy consumption. Solarwinds is also unable to report power usage for non SNMP enabled IP devices.
Summary
Cisco offers the most complete energy monitoring service, however it is now end of sale. Night Watchman, Taiga and Solarwinds provide partial view of network devices, and as such would provide patchy reporting on energy usage.
Problems with existing solutions
IT companies have developed systems which market their product/service towards IT departments. Solutions have combined monitoring and management capabilities. Which has resulted in the solution being costly to produce, difficult to install, configure and maintain.
This complexity has meant that facilities managers have not had an opportunity to measure energy usage for individual IP devices. They are not provided with support when identifying devices or technologies which could be made more efficient. Energy monitoring products within the IT sector have often be used as a proxy measurement to detect and isolate faults in communication.29. IT network and system designers are asked to build resilient, reliable platforms. This is evidenced by the fact that energy used in networks and data centres have increased as a proportion of energy consumption when compared to the IT sector.
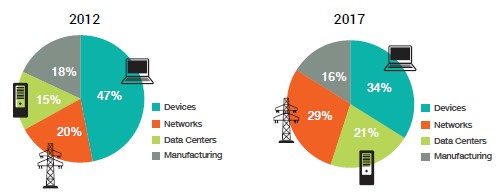
((Main components of electricity consumption for the IT sector, 2012. From Emerging Trends in Electricity Consumption for Consumer ICT))
IT designers are seldom asked to consider energy costs in their design. Whereas facilities managers are often tasked with reducing running costs of their estates. Providing real time granular energy usage information may promote energy efficient design.
Lessons Learnt
This section discusses the lessons learnt from other vendor software solutions and then proposes design solutions.
- Phase 1 \& Phase 3 – Products discussed within this chapter have incorporated phase 1 (i.e. passive monitoring Section, and phase 3 (i.e. energy management solutions Section) in a single product. This has increased cost of development due to the additional complexity of the solution. It has also increased ongoing maintenance of the product due to having to support power management on a wide range of device types running different operating systems and at different patch levels. As an indication of the fragmentation of the market, in 2013 there were circa 4,000 distinct Android devices, running 8 different operating system versions30.
- Energy monitoring is not a primary business. Products discussed in Section \ref{ExistingSolutions} are produced by companies who primarily sell products and services to the IT sector. Cisco primarily classify their products as enterprise, service provider and small to medium sized enterprises (SME). Cisco makes no mention of their energy management or monitoring capability on their home page or in their menus. IE which produces Night Watchman describe their business as “end point management through security, detection and remediation”. IE also says “We do not rip and replace, we leverage the infrastructure you have today, ensuring you maximize return on your existing investment.” IE does not explicitly mention energy monitoring as one of their services31. Solarwinds state on their home page “Solve your toughest IT management problem”, and there is no mention of energy monitoring or energy management within their products drop down menu.
- Limited Application. Taiga only support Windows and Linux operating systems, the platform does not support other operating systems e.g. MACOS or Andriod. SolarWinds only support devices which support specific SNMP MIBs. A Solarwinds platform is unable to infer energy usage information from devices which support SNMP but do not have a MIB which directly provides power utilisation. Due to these limitations, Taiga and Solarwinds are unable to monitor and report on energy usage for all IP devices in a network.
Summary
The UK has installed over 8 million smart meters in domestic homes. Smart meters have provided consumers with real time monitoring (RTM) data on their energy use and has resulted in short term energy usage reductions. However evidence of long term energy savings within the domestic environments appears to be weak. most studies into the effects of having a smart meter show that households reduced their energy consumption by just 2%-3%32.
The UK has also installed over 1 million smart meters in non-domestic consumers. Within this user base there have been examples of sustained energy reductions, for example, Superdrug installed 267 smart meters and made a cost saving of \pounds240k16. A BEIS survey reported that a large number of non-domestic consumers actively wanted to reduce energy use through active energy management33 and that there is a 39 per cent total abatement potential from current energy consumption. The BEIS report also stated that savings could payback investments in three years or less.
Existing solutions have attempted to monitor energy usage and manage devices. Monitoring relates to tracking devices and recording their energy usage. Managing devices are remotely managing the power status of the device. The largest vendor (Cisco) which monitored and managed the widest range of devices no longer sells the product. Smaller vendors support narrower ranges of end devices, but still looks to monitor devices and \textbf{manage} them.
There appears to be a gap in the marketplace, where a solution/product can poll, track and record power utilisation but does not support power management services (e.g. remotely powering off/on devices). Based on research the BEIS have conducted33, respondents were “actively seek new ways to reduce energy use” through the use of active energy management. BEIS also report that perceived barriers were economic (i.e. low capital availability, investment costs, hidden costs, intervention-related risks, external risks, and interventions not sufficiently profitable). BEIS report that respondents believed implementing energy efficiency measures on site required improved energy management knowledge.
If a low cost, relatively simple energy reporting solution was developed and marketed towards energy managers or facility managers it could be used to address some of the barriers to entry i.e. economic barriers. The solution could also help to improve customer energy usage knowledge. Providing non-domestic customers with information they could use to make energy saving changes within their organisations appears to be in demand which is currently not fully met.
- Sheldrick, B. & Macgill, S., 1988. Local energy conservation initiatives in the UK:their nature and achievements. Energy Policy, 16(6), pp. 562-578 [↩]
- IPCC, 2014. Climate Change 2014 Synthesis Report Summary for Policymakers. [Online] Available at: http://www.ipcc.ch/pdf/assessment-report/ar5/syr/AR5 SYR FINAL SPM.pdf [Accessed 20 April 2018] [↩]
- BEIS, 2017. Department for Business, Energy and Industrial Strategy. [Online] Available at: https://www.gov.uk/government/uploads/system/uploads/attachment data/file/670121/table 531.xls [Accessed 20 April 2018] [↩]
- Alahmad, M. A. et al., 2012. A Comparative Study of Three Feedback Devices for Residential Real-Time Energy Monitoring. IEEE TRANSACTIONS ON INDUSTRIAL ELECTRONICS, April.pp. 59-71 [↩]
- GOV.UK. (2018). Energy consumption in the UK. [online] Available at: https://www.gov.uk/government/statistics/energy-consumption-in-the-uk [Accessed 15 August 2018] [↩]
- Ofgem, 2017. Smart Meter Rollout, Energy Suppliers Progress and Future Plans, London, Ofgem [↩]
- GOV.UK. (2018). Building Energy Efciency Survey (BEES). [online] Available at: https://www.gov.uk/government/publications/building-energy-efficiency-survey-bees [Accessed 20 August 2018] [↩]
- BEIS (2017). Department for Business, Energy and Industrial Strategy. [Online] Available at: https://www.gov.uk/government/uploads/system/uploads/ attachment data/file/670121/table 531.xls [Accessed 20 April 2018] [↩]
- Alahmad, M., Wheeler, P., Schwer, A., Eiden, J. and Brumbaugh, A. (2012). A Comparative Study of Three Feedback Devices for Residential Real-Time Energy Monitoring. IEEE Transactions on Industrial Electronics, 59(4), pp.2002-2013 [↩] [↩]
- Hargreaves, T., Wilson, C. & Hauxwell-Baldwin, R., (2017). Learning to live in a smart home. Building Research & Information, 46(1), pp. 127-139. DOI:10.1080/09613218.2017.1286882 [↩]
- Gillespie, G., Manufacturing Knowledge, A History of the Hawthorne Experiments, Cambridge University Press, 1991 ISBN : 0521403588 [↩] [↩]
- Guardian, (2018). The Guardian Online [Online] Available at: https://www.theguardian.com/environment/2018/jul/21/smart-meters-to-save-uk-households-only-11-a-year-report-finds [Accessed 28 July 2018] [↩]
- Guardian, (2016). Smart meters: an energy-saving revolution or just plain dumb[Online] Available at: https://www.theguardian.com/money/2016/oct/01/smart-meter-energy-saving-revolution-cut-bills-gas-electricity[Accessed 17 August 2018] [↩]
- GOV.UK. (2018). Building Energy Efficiency Survey (BEES). [online] Available at https://www.gov.uk/government/publications/building-energy-efficiency-survey-bees [Accessed 20 August 2018] [↩] [↩]
- Theema, 2018. EMA MAG MAY 2018 [Online] Available at: http://www.theema.org.uk/wp-content/uploads/2018/05/EMA-MAG-MAY-JUNE-2018.pdf [Accessed 30 May 2018] [↩]
- Theema, 2017. EMA MAG MARCH 2017.pdf. [Online] Available at: http://www.theema.org.uk/wp-content/uploads/2017/03/EMA-MAGAZINE-MARCH-APRIL-DOWNLOAD.pdf[Accessed 30 May 2018] [↩] [↩]
- Merlo, A., Migliardi, M. & Fontanelli, P., 2015. Measuring and estimating power consumption in Android to support energy-based intrusion detection. Journal of 104 BIBLIOGRAPHY Computer Security, Issue 23, pp. 611-637. http://dx.doi.org/10.3233/JCS-150530 [Accessed 1 July 2018] [↩] [↩]
- Jain AK, M. M. F. P., (1999). Data clustering: a review. ACM Computing Surveys, 31(3), pp. 264-323. DOI: 10.1145/331499.331504 [↩]
- Prahastono, I., King, D. & Ozveren, C., 2007. A review of electricity load profile classification methods. Brighton, UK, IEEE, pp. 1187-1191. DOI:10.1109/UPEC.2007.4469120 [↩]
- Baer, W. S., Hassell, S. and Vollaard, B., (2002). Electricity Requirements for a Digital Society. s.l.:RAND Corporation. ISBN: ISBN: 9780833032799 [↩]
- Marson & Duffy, 2008. Two ways to measure power consumption. The Network World, Issue Feb, p. 38. https://www.networkworld.com/article/2283250/data-center/two-ways-to-measure-data-center-power-consumption.html [Accessed 30 July 2018]. [↩]
- Preist, C., Schien, D. & Blevis, E., 2016. Understanding and Mitigating the Effects of Device and Cloud Service Design Decisions on the Environmental Footprint of Digital Infrastructure. San Jose, California, CHI Conference on Human Factors in Computing Systems. [↩]
- Trend Controls, 2018. Trend Controls. [Online] Available at: https://www.trendcontrols.com/en-gb/Pages/default.aspx [Accessed 15 April 2018] [↩]
- Cisco, (2018). Energy Management Data Sheet. [online] Cisco. Available at: https://www.cisco.com/c/en/us/products/collateral/switches/energywise-discovery-service/data-sheet-c78-729774.html[Accessed 11 April 2018]. [↩]
- Cisco, (2018). SNMP OID to monitor power. [online] Available at: https://community.cisco.com/t5/security-analytics-and/power-consumption-via-snmp/td-p/1444263 [Accessed 25 July 2018] [↩]
- Monitor and Manage Power Consumption Using SNMP [Online] Available at: https://docs.oracle.com/cd/E19201-01/820-6413-13/05 pwrmgmt2.html [Accessed 14 August 2018] [↩]
- AMD, 1995. Magic Packet Technology, s.l.: Advanced Micro Devices. www.networkdrto.com/supp/3008/ndc1/ [Accessed 20 April 2018] [↩]
- Cisco, (2017). Cisco.com. [Online] Available at: https://www.cisco.com/c/en/us/solutions/collateral/service-provider/visual-networking-index-vni/complete-white-paper-c11-481360.pdf [Accessed 20 April 2018] [↩]
- Minovski, D., Rondeau, E. & Georges, J.-P., 2016. Monitoring the energy consumed by a network infrastructure to detect and isolate faults in communication architecture. Leeds, International Sustainable Ecological Engineering Design for Society (SEEDS) Conference. Arxiv ID: 1609.05710 [↩]
- Open Signal, 2013. Fragmentation 2013. [Online] Available at:https://opensignal.com/reports/fragmentation-2013/ [Accessed 14 April 201 [↩]
- IE, (2018). WhatWe Do. [Online] Available at: https://www.1e.com/what-we-do/ [Accessed 19 April 2018]. [↩]
- Guardian, (2016). Smart meters: an energy-saving revolution or just plain dumb [Online] Available at: https://www.theguardian.com/money/2016/oct/01/smart-meter-energy-saving-revolution-cut-bills-gas-electricity [Accessed 17 August 2018] [↩]
- GOV.UK. (2018). Building Energy Efficiency Survey (BEES). [online] Available at: https://www.gov.uk/government/publications/building-energy-efficiency-survey-bees [Accessed 20 August 2018] [↩] [↩]